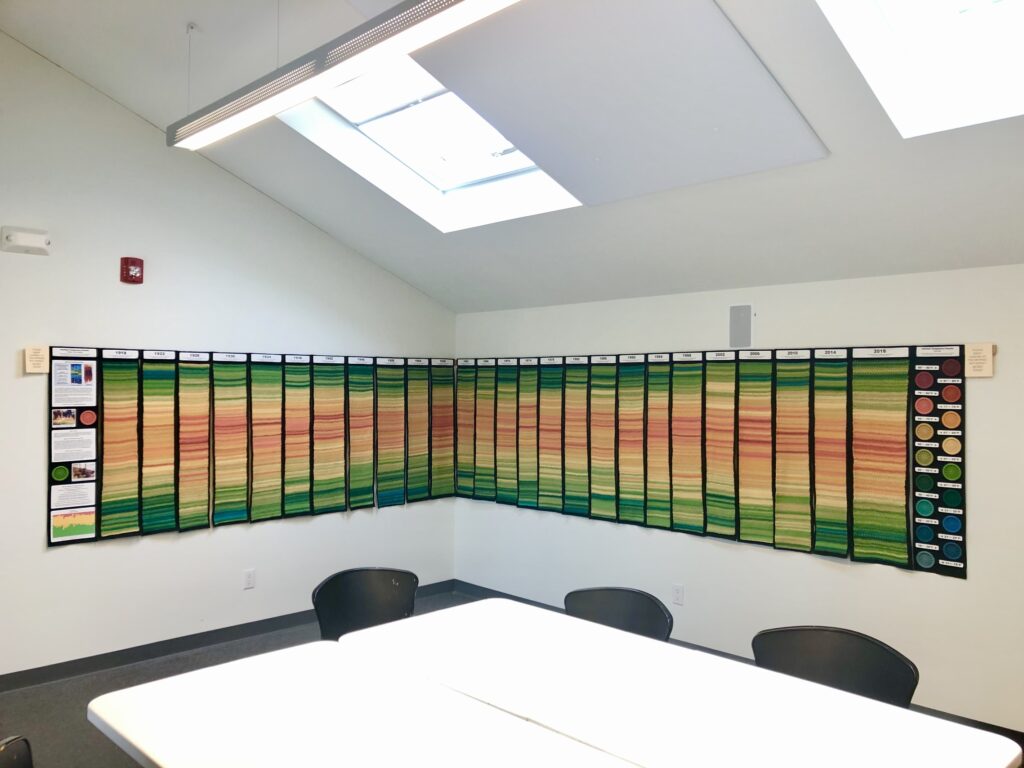
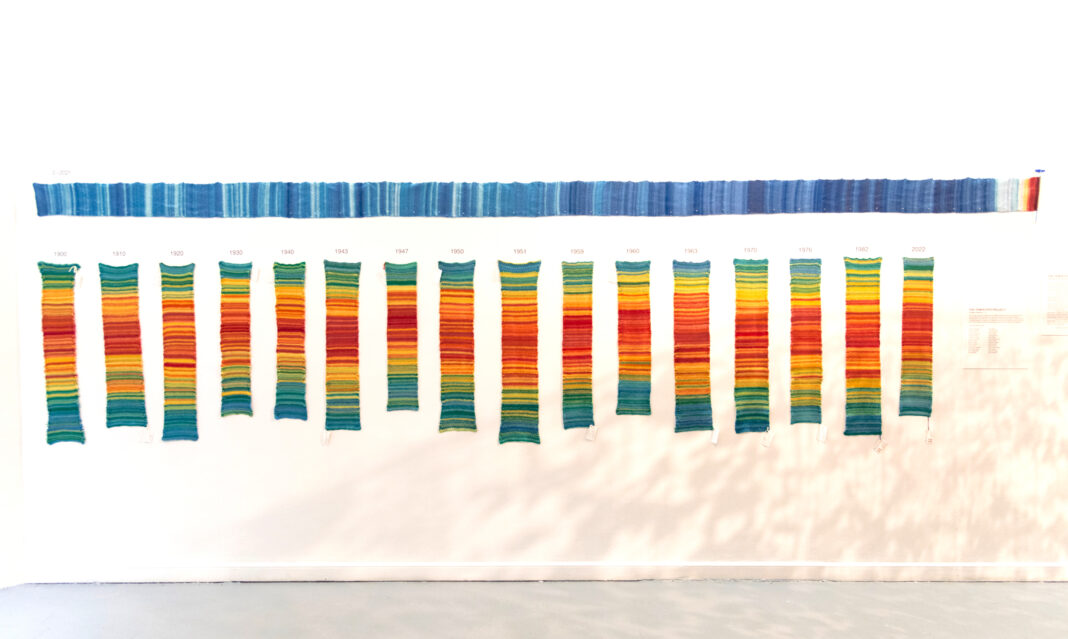
The Tempestry Project weaves science and craft into a thing of beauty.
Climate change is a scientific concept that some find hard to grasp. But there are ways to make it shockingly, graphically clear. Professor Ed Hawkins, a British climate scientist at the University of Reading, hit upon the idea of creating visual warming stripes, using a red to blue color spectrum to illustrate deviation-from-average global temperatures based on weather data for over a century. Three friends in Anacortes, Washington, took the professor’s idea one step further: Create textiles that use different colors of yarn to display different average temperatures in different locations. Outraged by former President Trump’s claim that climate change was a hoax, they formed The Tempestry Project in 2017. Hoping to create a widespread visual message about climate change, the project sells knit and crochet kits online to make it easy for others to make their own textiles with vivid horizontal bands of colors reflecting changing temperatures.
“Professor Hawkins used software to generate warming stripes. We use yarn so that crafters can re-create warming stripes as fiber art,” says Emily McNeil, a knitting store employee who co-founded Tempestry with her friends Marissa and Asy Connelly. Believing that a picture is worth a thousand words, Tempestry promotes the pairing of craft and science to create dramatic visual representations of the warming of our planet.
Each kit from Tempestry (the name is a hybrid of “temperature” and “tapestry”) contains yarn in different colors, with each color representing a five-degree range in temperature, along with temperature data from the National Oceanic and Atmospheric Administration. Armed with the color key and instructions, knitters pick the yarn color that matches a region’s average temperature during a certain time period. For instance, a red yarn named “Cayenne” represents 101–106°F. An average temperature range of 6–10°F is depicted by a blue called “Downpour.” A mustard shade named “Marigold” represents 66–70°F. The darker the red, the hotter the temperature it represents; the darker the blue, the colder.

Tempestry textiles have been exhibited at colleges and museums across the country, including Vassar College in Poughkeepsie, N.Y. Their textiles have also been displayed in museums in Chicago, in Friday Harbor, Washington, and in Cold Spring, N.Y., as well as at Philadelphia’s Schuylkill Center for Environmental Education and at an annual open house at Columbia University’s Lamont-Doherty Environmental Observatory Climate School.
Tempestry textiles have inspired the formation of climate change knit and crochet groups, and teachers are using them as classroom aids.
In Boulder, Colorado, for instance, eighth-graders created four Tempestry textiles to compare 1923 and 2021 statistics on local high temperatures with those in Mazatlan, Mexico (where some have family connections). “Data can be hard to understand in charts and graphs,” one student noted, adding art made it much easier.
A book, National Parks Tempestry Project, pairs photographs of national parks like Yosemite, Sitka, Glacier Bay, Death Valley and Pike’s Peak with two tapestries for each location: one depicts the daily high temperatures in 2016 (the 100th anniversary of the National Park system); the second shows the daily highs of 50 or 100 years before. Inspired by a gift of a colorful Tempestry textile, Erika Zambello, a volunteer, coordinated local crafters and photographers to produce the book for Tempestry, which was released in 2019.
Whether you’re creating or just admiring Tempestry craft projects, Asy Connelly calls them “accurate, tangible, relatable, and beautiful.” Not to mention, she says, “painfully obvious.”


